

The Structural Exhaustion of Portfolio Diversification
How does one respond to the lack of safe haven protection, evident from the February and March 2020 sell-off?
The COVID-19 pandemic is having a huge impact on health, global economic activity and financial markets. In many ways the impact overshadows the Global Financial Crisis of 2008. It now feels unimaginable how sanguine markets were in the first seven weeks of 2020. Again, we are in the midst of a battle between depressing fundamentals and a worldwide policy response from central banks and governments to prevent a full capitulation and damage beyond repair. What stands out is the speed of the market correction and the fact that almost nothing was able to compensate for the loss in equities. An institutional investor with a globally diversified portfolio has generally found little comfort in almost all other asset classes and alternative investments. There are structural reasons for this lack of offset and this paper will first focus on the reasons behind this. The question then becomes how to respond?
Bonds
The first asset to focus on is global government bonds. Historically, safe haven bonds have been seen as the best asset class to offer diversification versus equity risk. As central banks’ reaction function is generally to cushion economic and financial market shocks through lowering interest rates, the bond market has consistently, and for a very long time, delivered offsetting returns in adverse market conditions. And in the good old times, when the coupon yield was still positive, the cost of protection was generally minimal or even negative.
Here is a history of global bond yields.
Figure 1: 10-year Government Bond Yields

Source: Capstone, Bloomberg.
The return on global bonds has been stellar, but the return potential has been eroded by yields moving to record lows. In effect, we believe global bonds have offered all the protection that they had to offer. In our view we need to recognize that and be grateful, but stop extrapolating this. From here onwards, the expected return cannot match history anymore as that would require yields to dive into negative territory and accelerate lower continuously to compensate for the loss of the coupon as a return component.
A driver behind this has been the battle against inflation and, at a later stage, against deflation. Central banks have generally exhausted their toolkit. Not only are money market and short-dated bond yields at historical lows, but QE has also flattened yield curves, implying an absence of yield across all maturity spectrums. For example, the European 10-year swap yield, priced 40-year forward recently traded below minus 50 basis points. What can possibly generate a positive return from here onwards?
Commodities
In the search for diversification, another asset class that was accepted widely was commodities. Based on the stagflation experience of the 1970s, the common expectation was that commodity returns would show a negative correlation to equities and bonds in difficult times. During the 2001-2007 period, the rise of China and the lack of interest in the preceding years for the “old economy”, among other factors, gave commodities a boost.
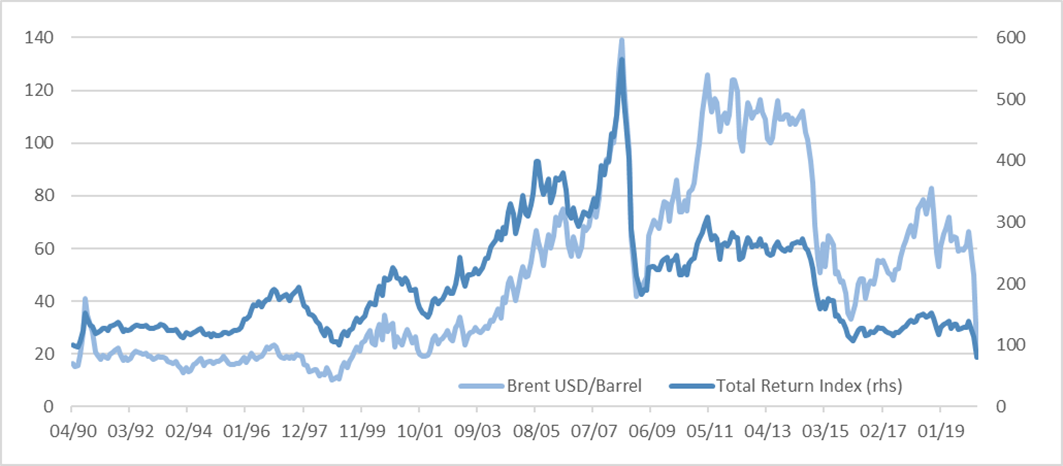
Figure 2: GSCI Commodities Index
Source: Capstone, Bloomberg.
The price of a barrel of Brent jumped from US$20 in 2003 to more than US$140 in mid-2008, from where it started to freefall. Although oil prices recovered towards 2011, the total return of commodities, as measured by the GSCI index, did not. Contango in energy and other commodities caused roll yields to be negative and the underlying cash yield component fell to unattractive (real) levels. The trauma of 2008 was that commodities added to the losses made in equities, which repeated itself in 2014-2015, when diversification was needed to weather the Eurozone and China slowdown crisis. And now again, in 2020, a price war within OPEC aggravated short-term market uncertainty, causing the asset class to add to the drawdown suffered in equities.
Emerging Markets Bonds and FX
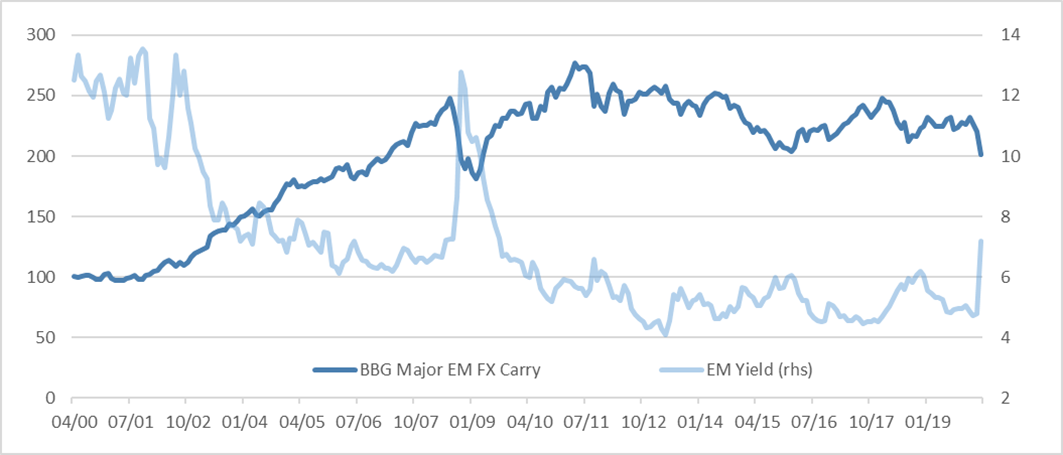
Finding diversification through investing in emerging markets has also been a struggle for a long time already. Although the return on the EMBI index has been good over the long haul to date, the sell-offs during times of stress have been quite painful – especially for those investors that became dissatisfied with hard currency EM yield spreads and decided to switch to local currency exposure. The EM FX carry index peaked in 2007, then got hammered in 2008, recovering handsomely and peaking again in 2010. During the last decade overvalued emerging market currencies combined low yields with depreciation trends and participated in about every serious stress episode as can be seen in Figure 3 below.
Figure 3: Emerging Market Debt and FX
Source: Capstone, Bloomberg.
Illiquid Alternatives
An important allocation in diversified portfolios has gone to illiquid assets, like private equity, alternative credit, infrastructure and natural resources. An attractive feature of these assets is that they are hard to mark-to-market and, for that reason, show more muted return fluctuations during normal times. However, under the surface, there are similar return drivers at work that influence changes in valuation. Those factors can remain hidden until a shock becomes so severe that valuations need to get a full reset. In such an environment, several vulnerabilities will likely surface, like leverage, cyclicality, possibly defaults and exposure to common factors like equity risk, credit risk and of course liquidity risk. Liquidity risk is positively correlated with equity risk and typically adds to the drawdown when diversification is needed the most. It can be difficult to understand how this asset class can play a role within a diversified portfolio if there is not enough transparency to be able to assess the risks of the underlying strategies.
Hedge Funds
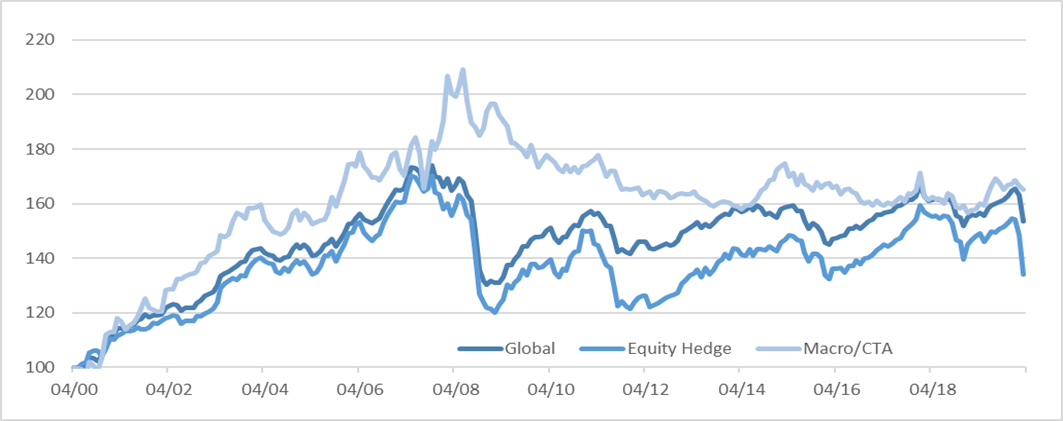
Hedge funds is another asset class that potentially can offset or mitigate equity drawdowns as correlations to equities of several hedge fund styles are low, time-varying or even negative. Naturally, the hedge fund styles that have a structural short bias tend to struggle in bullish market conditions. After years of disappointing performance, investors understandably give up and will have little exposure to hedge funds in a bear market event. Time-varying correlations can mainly be found in CTAs and Macro. These styles can prove to be very defensive as they have the ability to take sizeable short positions, which is about the only medicine in a “cash is king” stress event, like we experienced in 2008 and now in 2020.
Figure 4: HFRX Global Hedge Fund Indices
Source: Capstone, Bloomberg, Hedge Fund Research, Inc. www.hedgefundresearch.com.
Figure 4 above shows that the HFRX Macro/CTA index proved to be one of the better diversifiers during the 2008 Global Financial Crisis, but struggled since. One reason is that CTAs have evolved over the past decade and several of these strategies have focused more on market-neutral alpha generation than on being mainly directional, thereby staying protective. Whipsawing in equity short positioning has been painful, but also the defensive nature of trend-following in safe haven bonds and money markets has lost a lot of potential, in-line with the observation made when discussing global bonds. During the first quarter of 2020 the Macro/CTA index was down a moderate one percent, although several CTAs and Macro funds were able to deliver sizable returns, with potential to deliver more as the elevated volatility regime offers an improved opportunity set.
Risk Parity
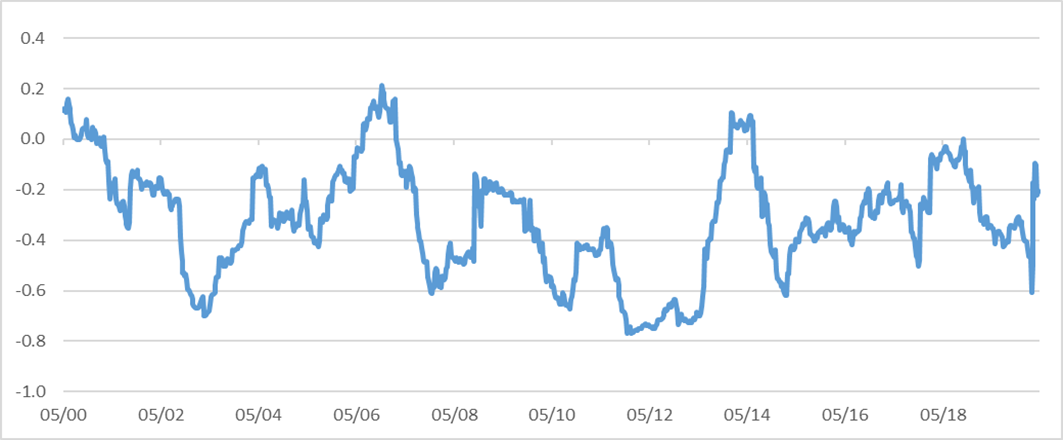
One of the successful portfolio construction formulae of the past two decades has been risk parity, building on the concept of improved diversification by equal risk-scaling of liquid asset classes. The sweet spot for risk parity is when assets realize a positive Sharpe ratio with low or even negative correlations amongst them. The main driver behind the success of risk parity has been the persistent negative correlation between bonds and equities and the high return to risk ratio of bonds. This correlation structure is regime dependent. For instance, during a stagflation/oil shock like we witnessed in the 1970s, the inflation spike hits both equity and bond returns in the same way as earnings and bond yields spike higher. Also, in the aftermath of the stagflation shock, the fall in inflation and return of economic growth benefits both bonds and equities, thereby keeping the positive return correlation intact for a while. However, since inflation fear was generally conquered around the late 1980s, the correlation between equities and bonds turned negative. With deflation fears as a main driver behind global markets corrections, bonds tend to do well when risky assets sell off. The past 20 years have shown a more or less reliable negative correlation, which is driven by the reaction function of central banks. If they need to counteract an economic slowdown, falling inflation and investor panic, we believe the recipe is easy. Lowering yields will serve all purposes and when it is not enough QE can help to drive longer-dated yields lower.
Figure 5: Correlation – S&P 500 vs 10-year US Treasuries
Source: Capstone, Bloomberg.
However, now that we have arrived close to the end station of the central bank’s firepower, the negative correlation regime is becoming much less reliable. That is also what we witnessed during the taper tantrum of 2013. Furthermore, Figure 6 shows what we have experienced during the Coronavirus shock in 2020. Two major bond markets with yields already at ultra-lows, the EU and Japan, initially rallied, but they started to retrace fast when the equity market accelerated down, thereby adding to the pain, especially in levered bond positions, as for instance applied in risk parity.
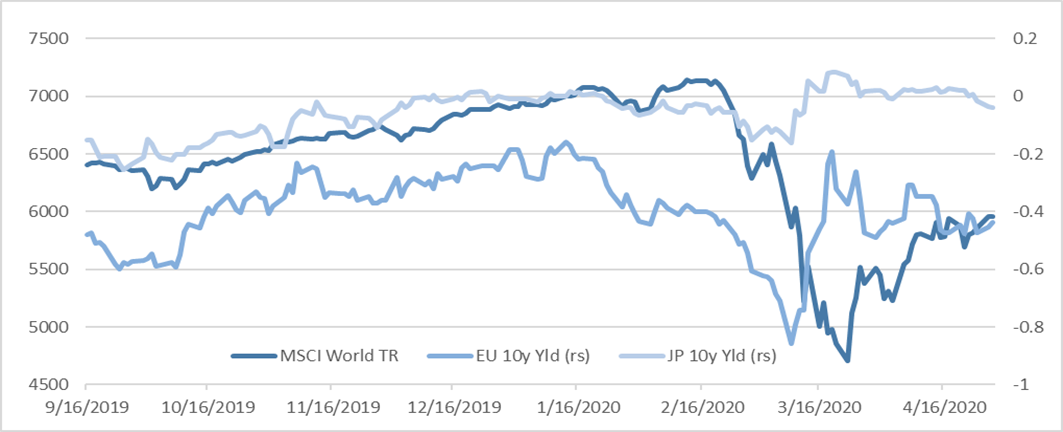
Source: Capstone, Bloomberg.
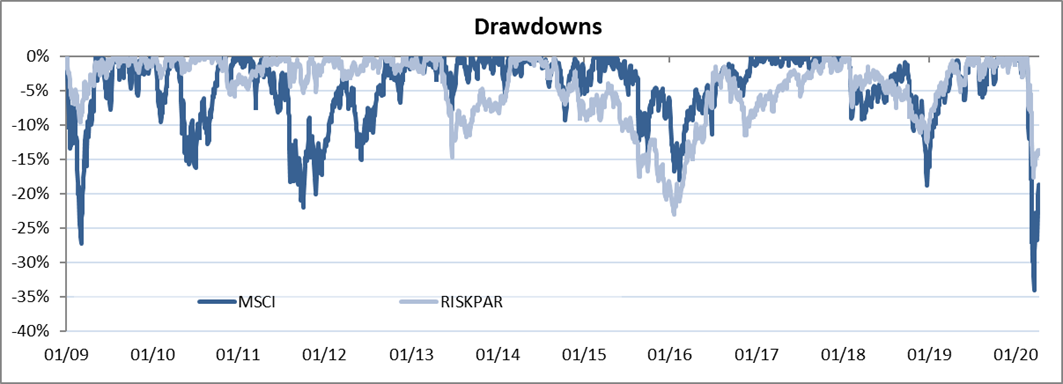
The observation that so many asset classes have started to fail in offering diversification to equities when it is needed the most is a worrying feature. Figure 7 summarizes this well. We have plotted the drawdown in MSCI World together with the drawdown in a representative risk parity portfolio. As one can witness, the balanced portfolio suffered deeper drawdowns during the taper tantrum episode in 2013, as well as in 2014-2015. Furthermore, the risk parity portfolio gave very little relief in 2018, both in February and towards the end of the year. And now again, in 2020 risk parity faced the harsh reality that few exposures helped dampen the drawdown.
Figure 7: Drawdowns
Source: Capstone, Bloomberg.
This poses a real challenge for investors with balanced portfolios. How do they avoid clustered drawdowns? What is the best way forward to mitigate equity drawdowns now that “safe haven” bonds seem to have been exhausted and have delivered all they had to give? Bonds have transformed from a return-generating asset class into an expensive insurance product. Any form of reflation or stagflation will cause future bond returns to turn negative. And the path towards negative yields looks troublesome as can be witnessed in Europe. Contrary to past expectations, the lower yields go, the more people need to save to ensure good pensions. Sweden dismantled negative rates and the core European countries would love to do the same. In conclusion, we believe that safe haven bonds at current valuations are no longer a free hedge. This challenges concepts like risk parity as one of the cornerstones of its success has been depleted.
Defensive Equity
Equities are our asset class of first choice. Listed companies represent the successful enterprises that are the engine behind economic growth and employment, while shareholders provide the risk capital needed to run those businesses. As an equity shareholder, one gets rewarded for profit generation and cash flow growth, and from a standpoint of return drivers, equity clearly generates fundamental added value. As companies grow, and multiples stay steady, an equity holder will receive dividend payments and additionally see a price gain equal to the underlying growth of fundamentals. Although the payout is structured differently, many other asset classes depend on the same return drivers. The reason why investors have always looked for portfolio diversification is because equities are mostly volatile, cyclical and illiquid in times of stress. The long-term average Sharpe of equities is about 0.4. The reason why equity returns are mostly higher than other asset classes is because its returns are relatively more volatile. The average long-term volatility is 16% versus an average total return of 6.2% (MSCI World net 1999-2020). Drawdowns have proven to be severe if sentiment and fundamentals turn, with several troughs deeper than 50% below peak values.
With the quest for protection through portfolio diversification becoming ever more challenging, we believe the focus must shift to a more direct approach with the goal to move the return distribution of equities to a less cyclical, less drawdown prone and more liquid profile. In the absence of proxy hedges, investors will need to play defensively within the equity asset class.
Addressing the Tail
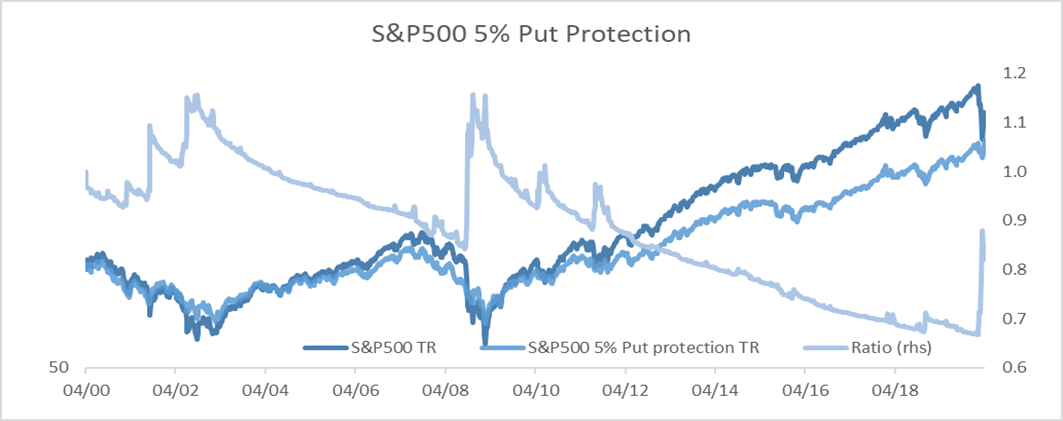
Figure 8 shows the added value of the CBOE S&P 500 5% Put Protection Index which is designed to track the performance of a hypothetical strategy that holds a long position indexed to the S&P 500 Index and buys a monthly 5% out-of-the-money S&P 500 Index put option as a hedge. As can be seen, the strategy is able to deliver a sizeable offset almost instantly when a bear market correction occurs. However, in normal times, the cost of running this put protection program is high as can be seen in the chart below. The ratio represents the cumulative difference between the unprotected and the protected portfolio.
Figure 8: S&P 500 5% Put Protection
Source: Capstone, Bloomberg.
From the perspective of a longer-term investor, it will be hard to switch from a return-generating diversifier, like safe haven bonds, to a protection overlay with an expected negative return. From a relative perspective, the equity hedge has become more attractive. Now that global yields have dropped towards zero or below, the opportunity cost has gone. One could even argue that in a normalization scenario with global reflation, the return on bonds will be negative as well.
Furthermore, there are alternatives to a relatively simple put protection program. They can be found in more advanced and tailor-made option strategies, but also in volatility optimized equity portfolio constructions. Furthermore there are possibilities to manage dynamically the equity beta through different market cycles geared towards capital protection.
With the structural exhaustion of portfolio diversification comes the need to shift the focus to more direct approaches to manage the return distribution of equities if investors want to better manage the sensitivity of their portfolio to sentiment shifts, cyclical downturns and liquidity events. Applying volatility insights to achieve this goal will be an important way to achieve this. We think the time has come the start to see volatility as an ally rather than an enemy.
DISCLAIMERS
The content of this document is confidential and proprietary and may not be reproduced or distributed, in whole or in part, without the express written permission of Capstone Investment Advisors, LLC (“Capstone”). The content herein is based upon information we deem reliable but there is no guarantee as to its reliability, which may alter some or all of the conclusions contained herein. No representation or warranty is made concerning the accuracy of any data compiled herein. In addition, there can be no guarantee that any projection, forecast or opinion in these materials will be realized. These materials are provided for informational purposes only, and under no circumstances may any information contained herein be construed as investment advice. This document is not an offer or solicitation for the purchase or sale of any financial instrument, product or services sponsored or provided by Capstone. This document is not an advertisement and is not intended for public use or additional further distribution. By accepting receipt of this document the recipient will be deemed to represent that they possess, either individually or through their advisors, sufficient investment expertise to understand the risks involved in any purchase or sale of any financial instruments discussed herein. Neither this document nor any of its contents may be used for any purpose without the consent of Capstone.
The market commentary contained herein represents the subjective views of certain Capstone personnel and does not necessarily reflect the collective view of Capstone, or the investment strategy of any particular Capstone fund or account. Such views may be subject to change without notice. You should not rely on the information discussed herein in making any investment decision. Not investment research. The market data highlighted or discussed in this document has been selected to illustrate Capstone’s investment approach and/or market outlook and is not intended to represent fund performance or be an indicator for how funds have performed or may perform in the future. Each illustration discussed in this document has been selected solely for this purpose and has not been selected on the basis of performance or any performance-related criteria. This document is not an offer to sell or the solicitation of any offer to buy securities. Capstone is not recommending any trade and cannot since it is not a broker-dealer. Nothing in this document shall constitute a recommendation or endorsement to buy or sell any security or other financial instrument referenced in this document.
Due to rapidly changing market conditions and the complexity of investment decisions, supplemental information and other sources may be required to make informed investment decisions based on your individual investment objectives and suitability specifications. All expressions of opinions are subject to change without notice.
Investments in alternative investments are speculative and involve a high degree of risk. Alternative investments may exhibit high volatility, and investors may lose all or substantially all of their investment. Investments in illiquid assets and foreign markets and the use of short sales, options, leverage, futures, swaps, and other derivative instruments may create special risks and substantially increase the impact and likelihood of adverse price movements.
Reference to Instruments and Indices:
References to indices are included for illustrative purposes only and are not intended to apply that any Capstone fund or account is similar to such index in composition or element of risk.
The S&P 500® Index (SPX) consists of 500 stocks chosen for market size, liquidity, and industry group representation. It is a market-value weighted index (stock price times number of shares outstanding), with each stock’s weight in the Index proportionate to its market value.
The S&P GSCI Total Return Index in USD is widely recognized as the leading measure of general commodity price movements and inflation in the world economy. Index is calculated primarily on a world production weighted basis, comprised of the principal physical commodities futures contracts.
The HFRX Global Hedge Fund Index is designed to be representative of the overall composition of the hedge fund universe. It is comprised of all eligible hedge fund strategies falling within four principal strategies: equity hedge, event driven, macro/CTA, and relative value arbitrage.
The MSCI World Index is a broad global equity index that represents large and mid-cap equity performance across all 23 developed markets countries. It covers approximately 85% of the free float-adjusted market capitalization in each country.
The CBOE S&P 500 5% Put Protection Index (PPUT) is designed to track the performance of a hypothetical strategy that holds a long position indexed to the S&P 500® Index and buys a monthly 5% out-of-the-money S&P 500 Index put option as a hedge. The PPUT Index rolls on a monthly basis, typically every third Friday of the month.
The Emerging Market Bond Index Global (EMBI Global) was the first comprehensive EM sovereign index in the market, after the EMBI+. It provides full coverage of the EM asset class with representative countries, investable instruments (sovereign and quasi-sovereign), and transparent rules. The EMBI Global includes only USD-denominated emerging markets sovereign/quasi-sovereign bonds and uses a traditional, market-capitalization weighted method for country allocation.
Notice to Investors in Australia
Capstone regulated by the SEC under US laws, which differ from Australian laws. Capstone is exempt from the requirement to hold an Australian financial services license under the Australian Corporations Act in respect of the financial services that it provides.
Notice to Investors in Brazil
The Fund is not listed with any stock exchange, organized over the counter market or electronic system of securities trading. Interests in the Fund have not been and will not be registered with any securities exchange commission or other similar authority, including the Brazilian Securities and Exchange Commission (Comissão de valores Mobiliários – or the “CVM”). Interest in the Fund will not be directly or indirectly offered or sold within Brazil through any public offering, as determined by Brazilian law and by the rules issued by the CVM, including Law No. 6,385 (Dec. 7, 1976) and CVM Rule No. 400 (Dec. 29, 2003), as amended from time to time, or any other law or rules that may replace them in the future. Acts involving a public offering in Brazil, as defined under Brazilian laws and regulations and by the rules issued by the CVM, including Law No. 6,385 (Dec. 7, 1976) and CVM Rule No. 400 (Dec. 29, 2003), as amended from time to time, or any other law or rules that may replace them in the future, must not be performed without such prior registration. Persons in Brazil wishing to acquire interests in the Fund should consult with their own counsel as to the applicability of these registration requirements or any exemption therefrom. Without prejudice to the above, the sale and solicitation of interests in the Fund is limited to professional investors as defined by CVM Rule No. 539 (Nov. 13, 2013), as amended, or as defined by any other rule that may replace it in the future. This presentation is confidential and intended solely for the use of the addressee and cannot be delivered or disclosed in any manner whatsoever to any person or entity other than the addressee.
Notice to Investors in California
This information is confidential. If you are not the intended recipient, please delete it without further distribution and reply to the sender that you have received the message in error. This message is provided for information purposes and should not be construed as a solicitation or offer to buy or sell any securities or related financial instruments in any jurisdiction. California residents should review our California Privacy Notice: https://www.capstoneco.com/regulatory-disclosures/#california_consumer_privacy_act
Notice to Investors in China
Interests in the Fund may not be marketed, offered or sold directly or indirectly to the public in China and neither this marketing material, which has not been submitted to the Chinese Securities and Regulatory Commission, nor any offering material or information contained herein relating to interests in the Fund, may be supplied to the public in China or used in connection with any offer for the subscription or sale of interests in the Fund to the public in China. Interests in the Fund may only be marketed, offered or sold to Chinese institutions which are authorized to engage in foreign exchange business and offshore investment from outside China. Chinese investors may be subject to foreign exchange control approval and filing requirements under the relevant Chinese foreign exchange regulations, as well as offshore investment approval requirements.
Notice to Investors in Japan
No filings have been made with respect to any of Capstone’s funds in Japan and the strategy is currently not intended for investment by Japanese investors. Thus, we are not providing this material to you for purposes of soliciting an investment in fund securities by you or your client investors, but rather to illustrate the manner in which we would plan to manage an asset management mandate (structured in a mutually acceptable and compliant form) granted to us by you should you so elect. By accepting this material, you acknowledge, confirm and agree that you have never been contacted by a representative of the fund or its manager in any manner which may amount to an offer to buy (or solicitation of an offer to buy) any interests in the fund in Japan.
Interests in the Fund are a security set forth in Article 2, Paragraph 2, Item 6 of the Financial Instruments and Exchange Law of Japan (the “FIEA”). No public offering of interests in the Fund is being made to investors resident in Japan and in accordance with Article 2, paragraph 3, Item 3, of the FIEA, no securities registration statement pursuant to Article 4, paragraph 1, of the FIEA has been made or will be made in respect to the offering of interests in the Fund in Japan. [The offering of interests in the Fund in and investment management for the Fund in Japan is made as “Special Exempted Business for Qualified Institutional Investors, Etc.” under Article 63, Paragraph 1, of the FIEA. Thus, interests in the Fund are being offered only to certain investors in Japan.] Neither the Fund nor any of its affiliates is or will be registered as a “financial instruments firm” pursuant to the FIEA. Neither the Financial Services Agency of Japan nor the Kanto Local Finance Bureau has passed upon the accuracy or adequacy of this Memorandum or otherwise approved or authorized the offering of interests in the Fund to investors resident in Japan.
Notice to Investors in Switzerland
Notice to Investors in Switzerland: The offer and the marketing of the fund’s Shares in Switzerland will be exclusively made to, and directed at, qualified investors (the “Qualified Investors”), as defined in Article 10(3) and (3ter) of the Swiss Collective Investment Schemes Act (“CISA”) and its implementing ordinance, at the exclusion of qualified investors with an opting-out pursuant to Art. 5(1) of the Swiss Federal Law on Financial Services (“FinSA”) and without any portfolio management or advisory relationship with a financial intermediary pursuant to Article 10(3ter) CISA (“Excluded Qualified Investors”). Accordingly, the fund has not been and will not be registered with the Swiss Financial Market Supervisory Authority (“FINMA”) and no representative or paying agent have been or will be appointed in Switzerland. This marketing materials, the Memorandum and/or any other offering or marketing materials relating to the fund’s Shares may be made available in Switzerland solely to Qualified Investors, at the exclusion of Excluded Qualified Investors. The legal documents of the fund may be obtained free of charge from [email protected].