

The Rise of Defensive Portfolio Construction
October 2024
The number of US State pension plans including defensive alternatives within their strategic asset allocation has more than doubled over the past five years, with assets invested growing at 30% per annum to reach a record high of $57bn1 at the end of 2022. Using detailed performance data available from March 2017 we find that the performance impact has been striking, as plans with a defensive asset allocation bucket have generated the same return as their peers but with an almost 20% reduction in portfolio volatility. While the approach has historically been successful, when we analyze portfolio holdings we believe investors can still do more. In this article we investigate the asset allocation evolution amongst the largest US investors and look in detail at how portfolio reallocations have increased resilience in periods of market stress.
The ever-increasing need for a balanced investment portfolio
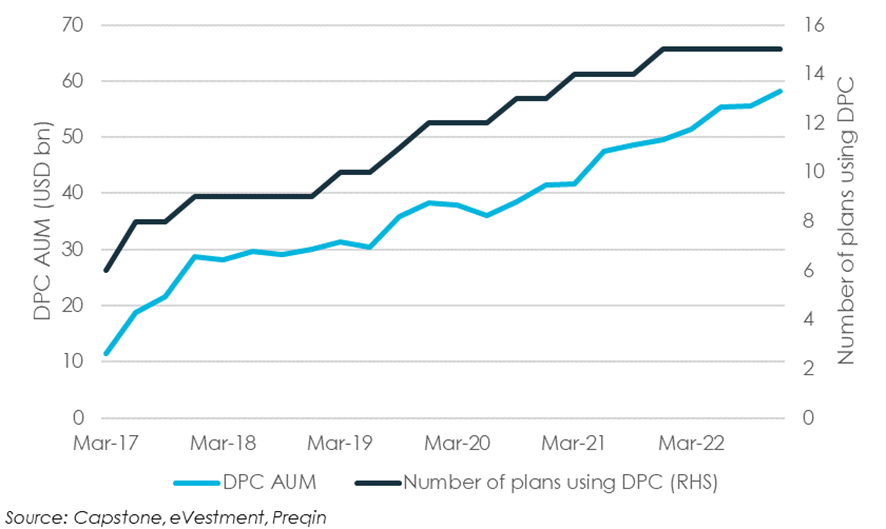
The turbulence of the 2020 Covid crisis followed by the historically poor performance of major asset classes in 2022 is forcing investors to add resilience to their portfolios. As diversification between traditional asset classes breaks down and forward-looking return expectations shrink, many are looking to alternative investments. Investors have overwhelmingly turned to private markets for growth, at the expense of a lack of diversification in stress. As a result, there is a need for asset classes that that can effectively mitigate portfolio risk. In response we are seeing significant growth in allocations to alternative investment strategies such as trend-following and tail risk hedging that are explicitly designed to diversify and protect portfolios if traditional asset classes underperform. (Fig. 1)
From being a relatively niche investment area as little as five years ago, the use of defensive portfolio construction (“DPC”) has grown steadily amongst US pensions, increasing from just $10bn assets invested by the top 100 plans in early 2017, to $57bn at the end of 20221. The growth has come from both larger allocations within each plan as well as from new users – the number of plans mentioning a defensive allocation has grown from just six in 2017 to 15 currently. Amongst the group, the average defensive holding is meaningful, now at 10% of plan assets under management.
Growth of Defensive Allocations in Top 100 US State Pension Plans (Fig. 1)
Under the hood – investor motivation and popular defensive investment styles
Although many investors are now tilting their portfolios defensively, allocations vary widely. Some are simply using long-dated Treasuries as a portfolio stabilizer, others are carving out the most diversifying parts of a traditional hedge fund allocation, whilst the most focused plans are allocating to explicit protection strategies. The motivation for adding defensive assets also differs across investors. Some take a broad approach, for example using a range of diversifying assets to target long-term return generation while reducing portfolio volatility. Others are more specific, focused on hedging tail risk to mitigate portfolio losses in severe equity drawdowns.
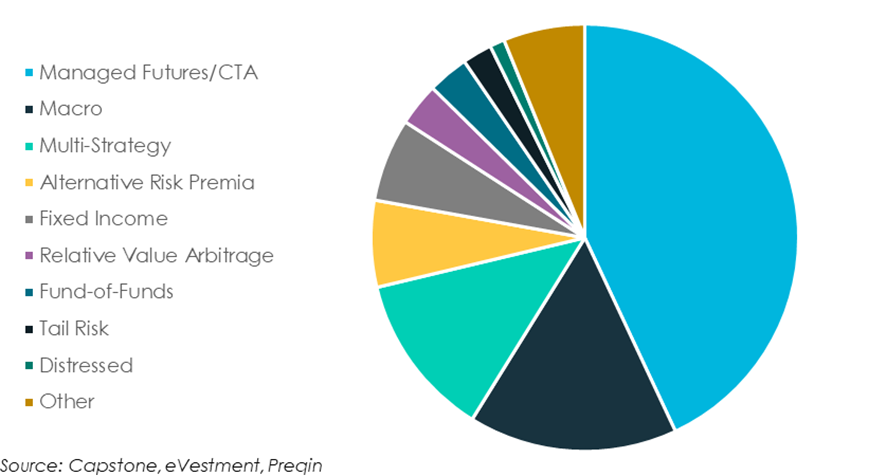
Analyzing portfolio holdings, we find that investors are overwhelmingly turning to trend-following, with managed futures strategies representing almost half of all defensive allocations. Macro hedge funds are the next largest, followed by multi-strategy funds and alternative risk premia. Tail risk hedging allocations are also present with smaller nominal allocations, but these strategies typically only require a small investment to protect a significant part of the portfolio. (See Fig. 2)
Investment Strategy Styles Comprising Defensive Allocations (Fig.2)
Does it work? across top US state pensions1
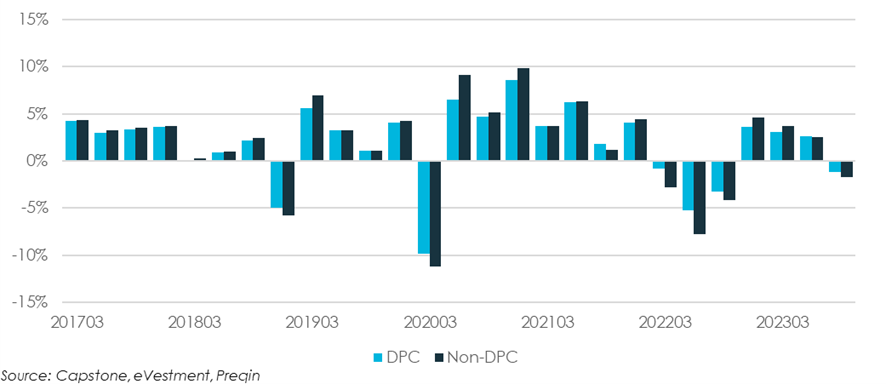
The key question is whether building a more defensive portfolio is improving investment returns. Historical performance analysis suggests it is – while the average top 100 US state pension plan lost 5%1 in the 2021-22 fiscal year, those with a defensive allocation ended almost flat. Focusing in more detail on quarterly returns shows that plans with a defensive bucket have outperformed their peers in every negative quarter since 2017, with drawdowns reduced by almost one third on average. We have performance data running from March 2017 to September 2023 and find that plans with defensive allocations achieved the same return as their peers over the period but with a meaningful 17%1 reduction in portfolio volatility. Bear in mind that these performance improvements came in a period of well above-average equity returns, with S&P 500 performance over the period in the top 30% of outcomes since 1927. We would argue that the benefit of a defensive allocation will be even more pronounced in the future if market returns normalize.
Average Quarterly Performance of Top 100 US State Pension Plans
What next?
Our analysis suggests that taking a defensive approach to portfolio construction is helping plan performance, but based on the allocations being made, we believe investors can do more. To illustrate our point, we show performance of the most popular defensive strategy styles in four significant stress periods since the 2007-2008 Global Financial Crisis.
Stress Performance of Defensive Portfolio Allocations
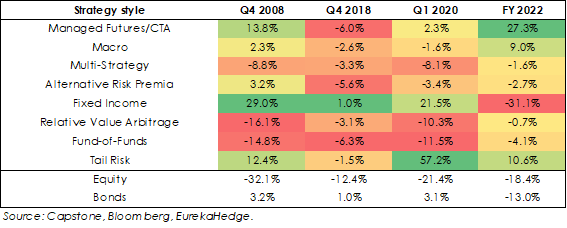
We make three key observations from the data:
- In every stress period at least one strategy delivered a negative return and no strategy returned positively in every downturn, highlighting that there is no panacea. Given the variation in performance, arguably investors are too concentrated in trend-following, particularly important given its cyclical equity correlation.
- Some strategies delivered negative returns in all our selected stress periods, specifically Multi-Strategy, Relative Value and Fund-of-Funds. While these strategies play an important role in generating returns over the cycle and funding the more protective allocations, their muted stress performance highlights the potential for ‘line-item risk’ and suggests that investors need to measure the effectiveness of a defensive allocation at an aggregate level.
- Finally, we note that tail risk hedging strategies clearly offer the most convexity in stress, and as such should arguably form a more significant part of a defensive allocation than is currently observed.
In summary, and as always, we believe diversification is the key – here we believe investors should be careful with investments that retain some stress equity beta, and allocate across a range of different strategies to strive to ensure the portfolio is protected in different types of market downturn. Recent academic research may help investors find the right balance – an article published by Adlard and Leake demonstrates how alternative investment portfolios can be constructed to target specific equity correlation levels, and provides a framework for quantifying the risk/return trade-off associated with defensive assets[2].
An underappreciated benefit – defensives as a source of portfolio liquidity in stress
A less commonly mentioned property of defensive alternatives is that they tend to favour strategies trading futures and options which can offer high liquidity. As such, any gains can be quickly monetized to redeploy elsewhere in the portfolio. With many investors currently heavily overweight holdings in illiquid private markets, other parts of the portfolio are having to work harder to provide portfolio liquidity – defensives can offer an ideal combination of both high liquidity and potential for positive performance in market stress.
The important benefit of liquidity is certainly true in Capstone’s own experience – all our investors in defensive portfolios were able to liquidate at least some part of those holdings with us in the Covid period and were able to use the cash we returned for either offensive allocations or other portfolio liquidity needs.
Investors take a strong first step but can go further
Defensive portfolio allocations are becoming ever more popular amongst institutional investors. Those who have taken the positive first step have had the opportunity to reap the rewards over the past half a decade, but as we analyze the allocations they are making, we identify several areas where perhaps more can be done to maximize the benefit.
Defensive allocations have proved their worth even as equities hit high historic highs – if markets begin to stumble, the benefits are only likely to become more pronounced.
[1] Capstone, eVestment, Preqin.
[2] Adlard, T., and Leake, T. 2024. “Quantifying Portfolio Diversification Benefit via Return Indifference Curves.” The Journal of Portfolio Management.
Disclaimers
The content of this document is confidential and proprietary and may not be reproduced or distributed, in whole or in part, without the express written permission of Capstone Investment Advisors, LLC (“Capstone”). The content herein is based upon information we deem reliable but there is no guarantee as to its reliability, which may alter some or all of the conclusions contained herein. No representation or warranty is made concerning the accuracy of any data compiled herein. In addition, there can be no guarantee that any projection, forecast or opinion in these materials will be realized. These materials are provided for informational purposes only, and under no circumstances may any information contained herein be construed as investment advice. This document is not an offer or solicitation for the purchase or sale of any financial instrument, product or services sponsored or provided by Capstone. This document is not an advertisement and is not intended for public use or additional further distribution. By accepting receipt of this document the recipient will be deemed to represent that they possess, either individually or through their advisors, sufficient investment expertise to understand the risks involved in any purchase or sale of any financial instruments discussed herein. Neither this document nor any of its contents may be used for any purpose without the consent of Capstone.
The market commentary contained herein represents the subjective views of certain Capstone personnel and does not necessarily reflect the collective view of Capstone, or the investment strategy of any particular Capstone fund or account. Such views may be subject to change without notice. You should not rely on the information discussed herein in making any investment decision. Not investment research. The market data highlighted or discussed in this document has been selected to illustrate Capstone’s investment approach and/or market outlook and is not intended to represent fund performance or be an indicator for how funds have performed or may perform in the future. Each illustration discussed in this document has been selected solely for this purpose and has not been selected on the basis of performance or any performance-related criteria. This document is not an offer to sell or the solicitation of any offer to buy securities. Capstone is not recommending any trade and cannot since it is not a broker-dealer. Nothing in this document shall constitute a recommendation or endorsement to buy or sell any security or other financial instrument referenced in this document.
Due to rapidly changing market conditions and the complexity of investment decisions, supplemental information and other sources may be required to make informed investment decisions based on your individual investment objectives and suitability specifications. All expressions of opinions are subject to change without notice.
Investments in alternative investments are speculative and involve a high degree of risk. Alternative investments may exhibit high volatility, and investors may lose all or substantially all of their investment. Investments in illiquid assets and foreign markets and the use of short sales, options, leverage, futures, swaps, and other derivative instruments may create special risks and substantially increase the impact and likelihood of adverse price movements.
Any indices included in this document are for comparison purposes and may differ from the strategy in many ways, including that they are unmanaged portfolios, do not reflect reinvestment of dividends or deductions of trading commissions, fees and expenses, and may have different investment objectives and/or characteristics. The volatility of indices may be materially different from the performance of the strategy. In addition, the strategy’s portfolio may differ significantly from the securities that comprise the indices. Given the varying nature of hedge fund investment strategies, the indices shown may or may not serve as a suitable comparison for the strategy. Capstone makes no warranties and does not in any way imply or suggest that the returns of the comparison indices will or should be similar to those of the strategy. This information is included merely to show the general trend in the market for the periods indicated and is not intended to imply that the portfolio was similar to the index either in composition or element of risk.
The S&P 500® Index consists of 500 stocks chosen for market size, liquidity, and industry group representation. It is a market-value weighted index (stock price times number of shares outstanding), with each stock’s weight in the Index proportionate to its market value.
References to indices are included for illustrative purposes only and are not intended to apply that any Capstone fund or account is similar to such index in composition or element of risk.